


Document Actions
gvSIG-Desktop 1.1. Manual de usuario.
This tool can be used to carry out theme mapping relatively easily.
To symbolise or represent the element data or variables in a layer, you can choose the most suitable colour, pattern, etc. for each one.
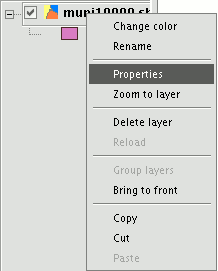
Go to the “Properties” menu (right click on the layer) to edit the legend symbol properties.
A new window appears. Click on the “Symbols” tab.
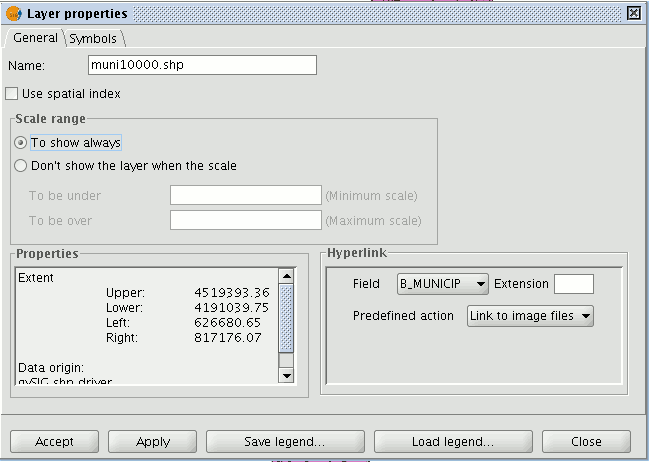
Use this tab to define the legend type you wish to use to represent the layer data more specifically.
You can choose between the following:
Unique symbols: This is gvSIG’s default legend type and represents all the elements of a layer using the same symbol. It is useful if you need to show the location of a layer over and above any of its other attributes.
Unique values: Each record can be represented by a unique symbol according to the value it has in a particular field in the table of attributes. It is the most effective method to show categorical data, such as towns, types of land, etc.
Intervals: This type of legend represents the layer elements using a range of colours. The intervals or graduated colours are mainly used to represent numerical data which increase progressively or have a range of values, such as population, temperature, etc.
Labelling: Texts or labels can be automatically added to the view according to the values each element has in a particular field in its table of attributes.
The options shown in the symbols menu vary according to the type of layer (point, line or polygon layer).
The options available for a polygon layer, which has the most configuration tools, are shown below.
A legend can be saved or loaded (recovered) at any time.


